High-dimensional Data-driven Energy optimization for Multi-Modal transit Agencies (HD-EMMA)
The goal of the project is to enable the development and evaluation of tools to promote energy efficiency within mobility as a service system currently operational in Chattanooga. For this purpose, we are developing real-time data sets containing information about engine idling status, engine temperature, engine speed, throttle, vehicle speed, GPS position, fuel usage and state of charge (electrical vehicles) from all vehicles in the fleet of the transit agency such as CARTA. We combine these datasets with information road gradient, traffic congestion, current events in the city and the braking and acceleration patterns. These high-dimensional dataset allow us to train accurate data-driven predictors using deep neural networks, for energy consumption given various routes and schedules. CARTA is planning to use these predictors for the energy optimization of its fleet of vehicles. We are evaluating our framework by comparing the energy consumption, comfort, etc. of the routes and schedules found using our data-driven framework to existing routes and schedules.
To make this large scale data collection and machine learning possible, the project is also developing new distributed machine learning methods that can handle data at such a rate and scale. These machine learning methods will enable high-resolution energy consumption predictors, contextualized with features such as vehicle types and events in the city. Having these predictors combined with traffic congestion information obtained from external sources will enable the agencies to identify and mitigate energy efficiency bottlenecks within each specific mode of operation such as electric bus and electric car.
Project collaborators include Chattanooga Area Regional Transportation Authority, Scope Lab at Vanderbilt University, the University of Houston, the University of South Carolina, Chattanooga Department of Transportation, the Enterprise Center, and the East Tennessee Clean Fuels Coalition.
Acknowledgement: This material is based upon work supported by the Department of Energy, Office of Energy Efficiency and Renewable Energy (EERE), under Award Number DE-EE0008467.
Datasets
All data mentioned in this page are available from files/hdemmadataset.tar.gz
Research Approach
The team’s approach is to use continuous monitoring sensors on the complete mix of CARTA transit buses and to develop predictors and optimization mechanisms using the data. Specific activities are:
- Acquire high-resolution (updated every minute) Spatio-temporal telemetry data from CARTA vehicles and exogenous data sources, such as traffic and weather
- Develop an efficient framework to store and process the operational data and external data, including street and elevation maps
- Create macro-level energy predictor using route information and general fleet parameters
- Create a higher-resolution micro model that is tuned to specific vehicle parameters
- Create an optimization framework to select the optimal assignment of vehicles to trips with the goal of reducing overall energy consumption
- Develop a visualization framework to analyze the data
Datasets
CARTA operates a mix of vehicle types, including gasoline-powered vans, diesel, and diesel-hybrid buses, battery-electric shuttles, and battery-electric buses, with production dates ranging from 1998 to 2016. CARTA provides service with 17 fixed routes, 3 neighborhood demand-response routes, 2 downtown circulator routes, and a complementary ADA paratransit service. The team configured operating data associated with vehicle routes, passenger counts, bus operators, and baseline performance for analysis. CARTA selected and installed a telematics kit produced by ViriCiti LLC (the DataHub) on each CARTA fleet vehicle, to provide a real-time data stream at a minimum 1 Hz resolution of all available vehicle operating parameters, as well as GPS positioning for each record. To ensure that we resolve this problem, the team has implemented a cloud-centric data collection and processing framework integrating MongoDB and Apache Pulsar.
The list of data recorded includes traffic and weather; speed, current, voltage and state of charge for all electrical vehicles; speed (km/h), fuel level, and engine fuel rate for ICEVs; various engine and driver parameters, including “accelerator pedal position”; GPS position; route; trip updates and patterns for all vehicles. All data is available from August 2019 onwards.
We provide access to snapshots of these data for public consumption below. We are working on releasing other datasets in the future.
OpenStreetMap
Openstreet map dataset provides various shapefiles required for geo-spatial analysis.
These files are available as listed below. To understand the differences between these files please visit the following page.
Folder Name: files/dataset/OSM
Vehicle Telemetry Data
The vehicle telemetry data is available for three diesel vehicles and three electric vehicles from months of September and October 2019. More data will be available soon.
Weather Data
Elevation Data
Macro Prediction Models
Using telemetry from the ViriCiti DataHub and external data sources, including weather, elevation, street-level maps, and traffic, the team trained and evaluated models for predicting energy as shown in the figure below. The key idea of macro prediction models is to develop planning foresight which can enable us to estimate the energy consumption of the whole fleet using macro data features such as road geometry, weather, traffic, and vehicle type.
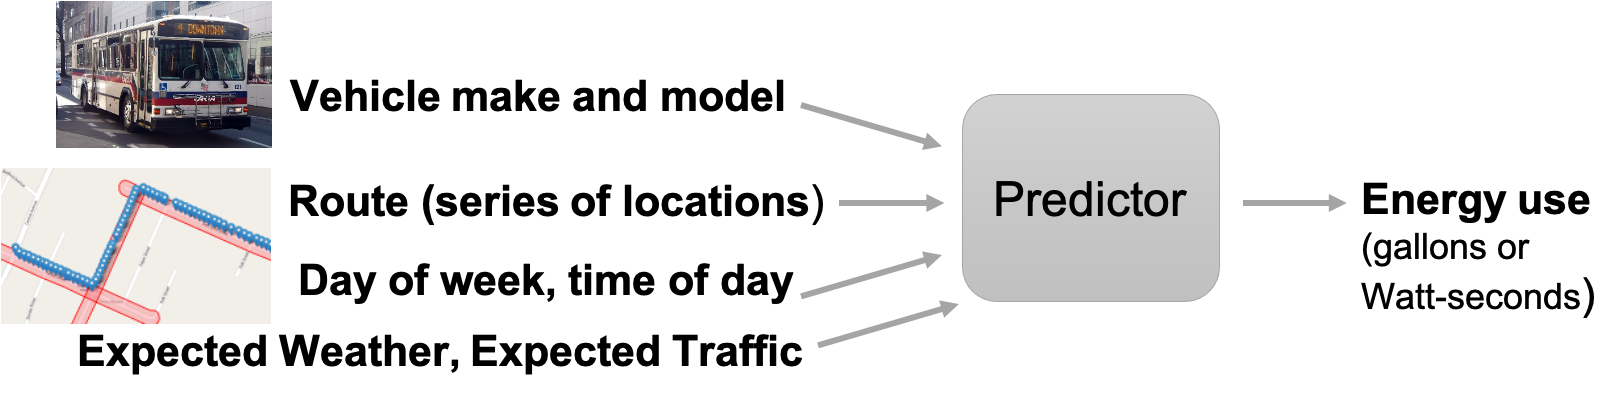
For EVs, the team collected the following features: timestamp, GPS-based position (latitude and longitude), battery current (A), battery voltage (V), battery state of charge (%), and charging cable status (0 or 1). For diesel and hybrid vehicles, instead of battery data, the team collected fuel level (%) and the fuel used, in gallons. For energy usage prediction, the team completed the following steps:
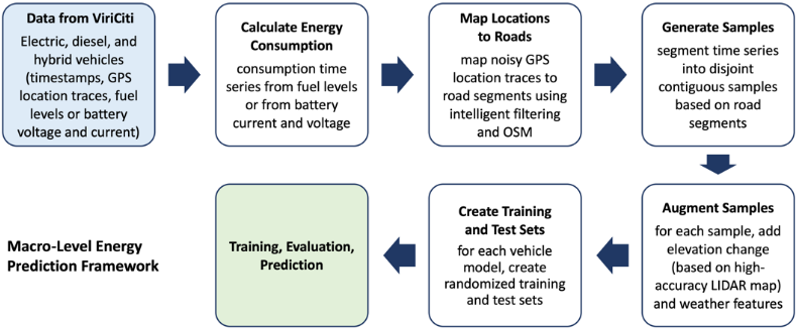
- Data Cleansing: Based on the GPS positions, the team first removed all data points that were acquired when a vehicle was in the garage and considered a vehicle leaving the garage to be the starting point for calculating energy consumption. For EVs, based on the charging cable status, the team also removed all data points that were acquired when a vehicle was charging.
- Calculating and Verifying Energy Consumption: Next, the team computed the energy consumed between consecutive data points. For EVs, the team converted changes in the state of charge (%) values to energy consumption, in Joules, based on the total capacity of the battery (1.8 × 10⁹ Joule for the CARTA vehicles). The team also computed energy consumption by integrating the product of the measured current and voltage values and verified that these consumption values coincided with changes in the state of charge. Since the current and voltage-based values are more accurate than the state of charge-based values, the team used the former in subsequent steps. For diesel and hybrid vehicles, the team performed similar steps with fuel level and the fuel used.
- Cleansing Locations and Mapping to Roads: The GPS based locations collected from the ViriCiti portal are inherently noisy, meaning some of the locations reported fall onto side-streets, where vehicles do not travel, onto parking lots, and even inside buildings. To remove noise, the team used a street-level map from OpenStreetMap. The team developed an algorithm that filters data and maps a GPS based location onto a street, considering previous and subsequent location measurements and various characteristics of nearby streets, and determines how likely it is that a vehicle travels on them.
- Sample Generation: Given the data points with street-level data, the team segmented time series into disjoint contiguous samples based on contiguous road segments, and, again, performed outlier detection and removal.
- Augmenting Samples with Elevation and Weather Data: For each sample, the team added features corresponding to elevation changes within the samples, and weather features, such as temperature.
- Training and Test Sets: For each type of vehicle, the team created training and test sets by dividing samples randomly. For each vehicle type, the entire dataset spans more than 3 months of data, collected at 1 Hz. The prediction models used the following sample features: distance traveled, travel time, road types (e.g., motorway, residential), elevation change, weather features, and energy (fuel or electricity) consumed. The team applied three different approaches for creating prediction models: linear regression, deep feed-forward neural-network learning, and decision-tree regression. The team compared the performance of these approaches based on their mean prediction errors for the test datasets and found that decision tree regression results in the most accurate prediction.
The figure below summarizes these steps
Brief Description of Models
Notebooks showing the Prediction Results
- Electric Vehicles. It is also available on Google Colab
Data Samples for Energy Prediction Models
Publications
Results and the problem setup is available from the following paper: Data-Driven Prediction of Route-Level Energy Use for Mixed-Vehicle Transit Fleets.
Micro Prediction Models
In addition to the macro energy models which are applicable for route-specific analysis, we also worked on developing micro models that are finely tuned to individual vehicles. These models are essential to estimate energy consumption under various traffic control and operational strategies. Thus, they are widely used by researchers and transportation practitioners in evaluating benefits and comparing traffic control and operational strategies. Based on a comprehensive literature review of energy consumption models of EVs (described earlier), we can conclude that there is a knowledge gap for electric bus energy prediction models.
For this purpose, we developed an ensemble of neural network-based EV bus prediction models that achieve better accuracy performance compared with regular regression models, and accuracy performance comparable to physics-based models. The decision tree of these models is shown below.
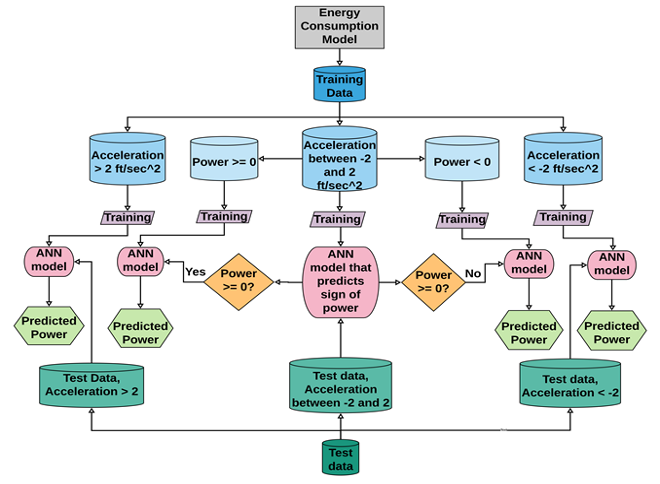
The models cover three different driving situations: regenerative braking (acceleration < -2 ft/s2); aggressive acceleration (acceleration > 2 ft/s2); and cruising (acceleration between -2 and 2 ft/s2). The accuracy of the three models outperforms the single model for predicting all driving conditions. This is because these three different scenarios are effectively three different modes, and energy consumption dynamics vary significantly between them.
Notebooks showing the Micro Prediction Models
- Electric Vehicles. It is also available on Google Colab
Data Samples for Micro Prediction Models
Publications
This work is pending publication and details will be released soon.
Optimization framework
EVs incur lower energy costs and environmental impact during operation than comparable ICEVs; however, their upfront costs are much higher. As a result, many public transit agencies can afford only mixed fleets of EVs and ICEVs. Making the best use of such a mixed fleet of vehicles presents a challenging optimization problem. First, agencies need to decide which vehicles are assigned to serving which transit trips. Since the advantage of EVs over ICEVs varies depending on the route and time of day (e.g., the advantage of EVs is higher in slower traffic with frequent stops, and lower on highways), the assignment can have a significant effect on energy use and costs. Second, agencies need to schedule when to charge EVs with limited battery capacity and driving range that are not enough for an entire day of transit service. Scheduling must also consider charging infrastructure limitations, e.g., a limited number of charging poles, or limited peak load on the electric grid.
We have developed a novel problem formulation and algorithms for assigning a mixed fleet of transit vehicles to transit trips and for scheduling EV charging. The problem formulation is general and applies to any transit agency that has to provide fixed-route transit service using a mixed fleet. The objective is to minimize energy use (i.e., fuel and electric power use), which can be used to model minimizing operating costs and/or environmental impact with the appropriate cost factors. To solve the problem, the team introduced an integer program, as well as domain-specific heuristic and genetic algorithms. The team evaluated the algorithms on CARTA’s transit routes using the macro-level energy predictors to evaluate the objective. The results show that the heuristic and genetic algorithms are scalable in terms of computation time, and they provide near-optimal results.
Publications
Results and the problem setup is available from the following paper: Minimizing Energy Use of Mixed-Fleet Public Transit for Fixed-Route Service
Data Architecture and Visualization
In addition to the problem of having the right data available at the right place, we and other urban science researchers have to also deal with the inefficiencies of querying and operating on the high volume and high-velocity geospatial data. Let us look at an example focused on public transit bus routing. The table below breaks down two separate sets of queries a public transit bus application may need. First, we may need to find all vehicles within a region. Most databases with spatial extensions can handle this query within a polygon use case - including document stores and specialized spatial databases such as ESRI or PostGIS. Case two is an application that wants to identify bottlenecks along bus routes. This is more complicated, as we need to combine data from multiple data sources with various schemas
| Goal | Data Needed | Queries Needed | Storage |
|---|---|---|---|
| Identify buses in a region. | bus locations and bus route | buses within polygon and aggregation across time | spatial indexed data store |
| Identify bottlenecks on bus routes. | bus route, bus speed, surrounding traffic, road network infrastructure | road shape along route, traffic per road segment, bus route ID, bus speed and weather | graph data store |
Existing data stores have the ability to aggregate values along spatial and/or temporal dimensions using indexing structures such as B-tree, R-tree, KD tree, etc. In this context, geo-data types typically consist of single-point values or trajectory paths that are composed of paths of geo-points. Modern databases including Oracle, MongoDB, Redis, Couchbase, and Neo4J provide geo datastores. Additionally, the difficulty in storing geospatial data has given rise to specialized databases including Esri and PostGIS that are centered around storing and querying geo-data quickly and efficiently. To incorporate temporal dimensions these data stores use time stamps associated with each data value.
Whether using spatial indexing in general-purpose databases such as Oracle, MongoDB etc. or working with a specialized geospatial data store such as Esri and PostGIS there are three primary problems developers face. First, the variety of approaches tends to result in ad-hoc solutions in which geospatial storage is tacked on to existing data stores not optimized for working with such data. Second, it ignores the high variability of data sources and data schemas associated with a project like ours. As schemas from different data sources are often unrelated and challenging to work with, fitting them into a single type of index or data model makes efficient access to such data challenging. Lastly, while these storage models are effective for aggregating values along spatial and/or temporal dimensions, they fail to capture the correlations between spatial and temporal dimensions. Spatiotemporal analytics, in particular, require a fine-grained understanding of these correlations to build accurate predictive models. Additionally, real-time predictions require efficient querying of such data. These queries often require searching for similar scenarios based on complex Spatio-temporal correlations at a granular level existing approaches fail to address.
Our Solution
Our solution integrates a distributed ledger with structured views provided by specialized databases.
Distributed Ledger
This project has data from Viriciti, clever devices, traffic, and weather. The large variance in data structures presented makes a unified schema for all data sources impossible. However, all data sources have two shared dimensions: time and space. In terms of time, each event regardless of the data source is typically timestamped representing a single point in time at which point that event occurred.
A distributed log/ledger provides an append-only data structure in which new events are added to the ledger as data streams into the system. The append-only structure of distributed ledgers naturally mimics the temporal nature of incoming smart city data, making it “real-time data’s unifying abstraction” (Kreps 2013). By storing highly various data in this fashion, users can obtain data quickly and efficiently across the unified dimension of time which is ideal for both real-time applications as well as historical analysis for a given time range.
The governing principle of the distributed ledger is immutable facts. These immutable facts provide the source of truth from which all other data stores are derived. The immutable nature of the distributed log provides strong consistency and replication at the heart of the spatiotemporal data store architecture. By providing hierarchical ledgers and locating them in different geographies we can provide access to real-time streaming data.
We implemented the distributed ledger using Apache Pulsar (Pulsar 2.4.0). Apache Pulsar is described as the “next-generation pub/sub messaging system” and was developed at Yahoo (Merli, Ramasamy 2019). In contrast to similar messaging systems, such as Apache Kafka, Pulsar uses Apache BookKeeper to implement the ledger in a distributed manner. This is important as in many smart city applications the volume/velocity of incoming data is highly variable between data sources. While systems such as Kafka implement a data store per topic, the distributed nature of BookKeeper provides a more efficient mechanism for storage in the ledger.
A second critical aspect of Apache Pulsar is that the processing demands required from brokers are separated from the storage demands of the distributed ledger. By separating these two concerns, the system can be easily scaled in terms of processing and/or storage separately. This means as demands of the system change, additional processing and/or storage can be added as needed.
Derived Structured Views
Structured data views are derived from the distributed ledger and can be used for analytical queries that can sustain latency. As previously discussed, the distributed ledger is an ideal data structure for representing the shared time dimension across the various data sources. The structured data views provide access to the second shared dimension - space. For this, our prototype architecture has a document-based structured view (MongoDB), and a graph-based structured view (Neo4J).
Our MongoDB view represents space through R-Tree geospatial indexing, a common spatial representation used in specialized geo datastores such as Esri and PostGIS as well as general-purpose data stores such as PostgreSQL. This data view is highly efficient for aggregate spatiotemporal queries that can sustain latency. A common use case of this view is sharing data between colleagues as well as batch processing and analytics.
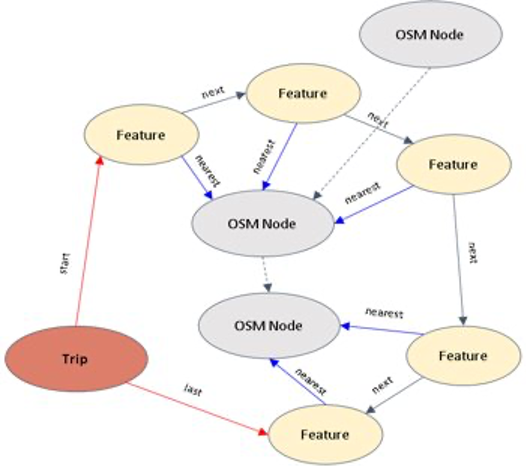
The graph view provides an efficient data structure for highly related spatial data and is provided for complex traversal queries, such as routing, of the data by storing geospatial network data. To provide consistency on the data we plan to use Open Street Map (OSM) data to generate a transportation routing network stored in the Neo4J and then tie the urban data to the network as shown in the figure below.
The modular nature of our data storage system makes it highly extensible. New data stores such as SQL, Document-based, specialized geospatial stores can be added and removed easily. Additionally, new data stores can quickly catch up to data by simply reading through the logs on the topics in which it subscribes to. This makes adding and removing new structures trivial. The same works for latency-sensitive client applications, which can attach directly to the distributed log or to structured data views that are optimized for various data schemas.
Disclaimer: This site describes the account of work sponsored by an agency of the United States Government. Neither the United States Government nor any agency thereof, nor any of their employees, makes any warranty, express or implied, or assumes any legal liability or responsibility for the accuracy, completeness, or usefulness of any information, apparatus, product, or process disclosed or represents that its use would not infringe privately owned rights. Reference herein to any specific commercial product, process, or service by trade name, trademark, manufacturer, or otherwise does not necessarily constitute or imply its endorsement, recommendation, or favoring by the United States Government or any agency thereof. The views and opinions of authors expressed herein do not necessarily state or reflect those of the United States Government or any agency thereof.